A friend sent me Safi Bahcall’s book “Loonshots: How to Nurture the Crazy Ideas that Win Wars, Cure Disease, and Transform Industries” a couple of months ago. It’s a fascinating book with many interesting ideas and stories, the most important of which is (arguably) the Innovation Equation, a model that seeks to explain, in a quantitative way, why the larger an organisation is, the harder it is to innovate in it, and what can one do about this state of affairs.
The basic ideas behind the model are quite intuitive:
- Organisations can be studied as thermodynamical systems where, at any one time, the decisions of individuals in an organisation are driven by multiple conflicting forces, and the exact balance of those conflicting forces can introduce phase transitions in organisational behaviour.
- In an organisation, individuals that seek career progression will either dedicate their time to doing actual productive work or engage in political games like self-promotion or undermining others, and what they chose to do is dictated by the incentive system in place.
- In particular, in organisations that are hierarchical and celebrate rank rather than results, where the reward for being promoted to the next level is more attractive than the reward for achieving excellent results in one’s work, tend to encourage politicking rather than work excellence.
- One other important factor is that organisations that don’t pay enough attention on the fit between staff’s skillsets and the work assigned to them also tend to encourage politicking because for those staff that aren’t good at what they are asked to do, the return-on-politics is better than return-on-work.
Putting all these ideas into a quantitative model and putting conditions on what percentage of time an individual in an organisation will choose to devote to actual productive work versus politics, Bahcall arrived at the following formula for M, the maximum number of people that can work well together, free of politics, in an environment that encourages innovative work:

where G is the salary growth rate up the hierarchy (e.g. G = 12% means every promotion, on average, results in a 12% increase in base salary), E is the equity fraction of one’s compensation package that is tied to the quality of their work (e.g. E = 30% means 30% of one’s total remuneration is tied to performance on assigned work), S is the management span (e.g. S=6 means each manager supervises, on average, 6 direct reports), and F is a measure of organisational fitness defined (roughly) as the ratio between return-on-work and return-on-politics, where return-on-work is directly related to the fit between skillsets and assigned work.
Bahcall’s claim is that below the threshold M, incentives encourage employees to focus on work and unite around innovative projects (like novel high-risk high-return “loonshots”), but above this threshold, career considerations become more important and politics suddenly appears to create a corporate environment that favours franchise projects (low-risk ideas with incremental returns) and kills innovation projects and everything else.
In the spirit of all models are wrong but some maybe useful, let’s look at what the model says. First of all, increases in the equity fraction increases the number M, which makes sense since a greater equity stake encourages individuals to spend time on productive work rather than on politics. Increasing the management span, which reduces the number of layers in the organisational hierarchy, also increase the number M. So flat structures are better than hierarchical structures, but there is a natural limit to how big S can grow, which in turn depends on whether one is running a centralised command-and-control operation (e.g. manufacturing, logistics, etc) or a decentralised operation (e.g. investment banking, research and development, sales, etc). Lastly, that increases in organisation fit (ratio of skills fit to return-on-politics) also translates to a linear increase in M is intuitively right but organisation fit is not easy to measure in general. (It’s not completely clear to me why skills fit and return-on-politics should be treated as a single factor in the M equation rather than two separate factors will potentially different weighting; it’s not even clear to me that there is a natural ratio here in that the dimensions of skills fit and return-on-politics aren’t necessary compatible.)
Let’s look at what the M equation says for an “average company” with S=6 (each manager has 6 direct reports), G=12 (typical step-up in salary from promotion of 12%), E=50% (compensation package is 50% base salary and 50% at-risk performance bonus), and F=1 (it’s equally attractive to focus on one’s work and to play politics). Plugging these numbers in, we get
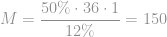
That doesn’t look obviously wrong. Doubling F and keeping everything else the same gets us to M=300, which is still sensible. So it looks like it’s not hard to scale an innovative organisation to one to two thousand people without losing the innovation culture by just doing what all the different things management books and consultants say we should do.
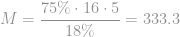
Let’s now look at what the M equation says for a typical Australian government agency, where the notable difference is that E is usually negligible to non-existent (mostly because most government agencies only have costs but no revenues and profits to speak of), G is fixed at around 18% (until one gets to the Senior Executive Service level, where G is 40% or higher), S is around 6 to 14, and F is usually low because the large number of generalists in public service means work and skills fit at the middle-management level can be sub-optimal. Plugging some indicative numbers in, we get

This supports many people’s observations that companies are usually more innovative than public-service agencies, and the larger the public-service agency, the harder it is to get innovative work going. Now we can also see some logic in introducing skilled contractors (at the worker-bee level) into the government workforce, which will lift the average E and F numbers at the price of introducing pay disparities between public servants and contractors who do essentially the same job, which is manage-able as long as the disparities are not unreasonable.
How about universities? For academics, E is usually large but intangible, appearing in the form of prestige, peer recognition and self-actualisation; F is high because of domain specialisation — it is said that academics are rewarded for knowing more and more about less and less 🙂 — and fairly effective independent assessments of expertise, which reduces the need to play politics to get promotions; S is typically small at 2-6 (including PhD students); and G is typical at around 18%. Plugging some indicative numbers in, we get
That also passes the smell test. It looks like the simplest way to increase M for universities is to increase S, but that usually requires additional external funding from either federal research funding vehicles (a decision for politicians) or industry engagements (a decision that individual research groups can make for themselves).
I don’t encounter many new ideas in my reading anymore, but Brahcall’s ideas and his Innovation Equation look fresh to me. The Innovation Equation is derived from a simple model based on first principles, rather than empirically inferred from data, so there’s a need to validate it with more data and evidence, but science makes progress by turning (insightful) qualitative knowledge into (testable) quantitative knowledge and I for one am glad that we now have a simple practical model to hang all the innovation and management idioms and proverbs we hear from all the gurus and preachers. 🙂
Here’s a question for readers in the meantime: how does Agile practices affect the different factors in the M equation?
